
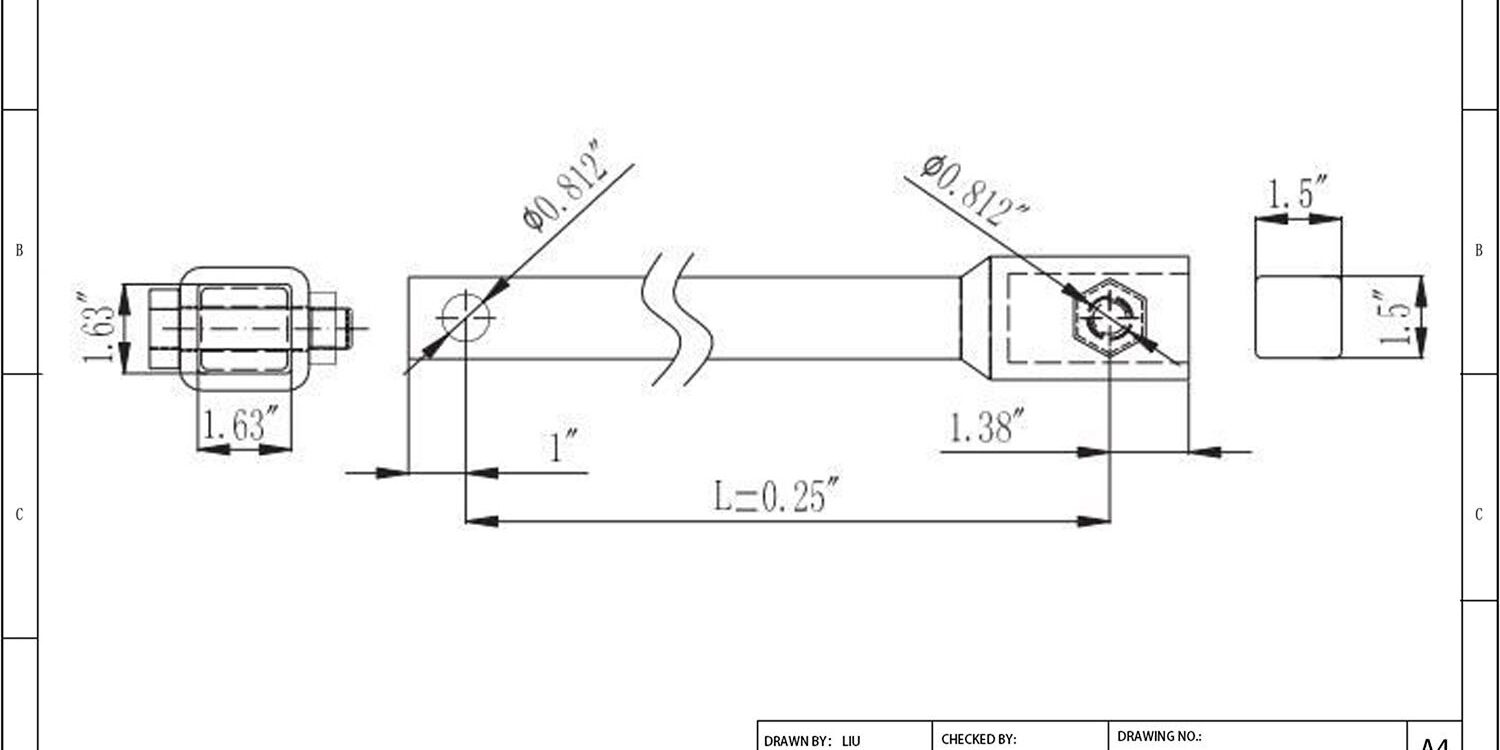
Most engineering specs treat helical tieback anchors as simple screws you drive into the ground until they hold. That mindset causes failed retaining walls and wasted procurement cycles on power transmission sites. These anchors are actually precision load-transfer systems that counteract lateral soil pressure through welded bearing plates on a square steel shaft. The holding capacity scales directly with installation torque, typically yielding approximately ten pounds of pull resistance for every foot-pound of applied torque. Matching that metric to your geotechnical report prevents over-engineering and keeps unit costs predictable.
Generic load charts fail in the field. You will derive ultimate capacity from raw soil data instead. This breakdown shows you how to map SPT N-values to specific helix plate diameters and calculate the exact embedment depth required to hit your target load. We also cover how to verify extension coupling strength before finalizing your purchase order. The result is a repeatable sizing workflow. It eliminates guesswork, cuts down on site rework, and keeps your procurement pipeline moving.
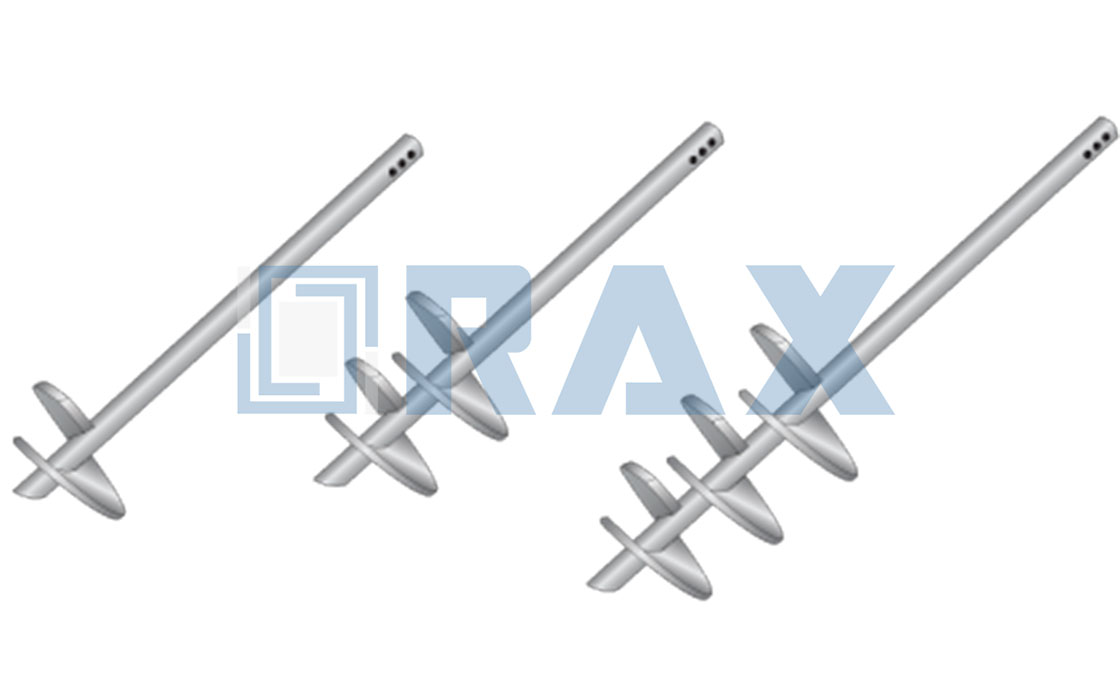
Table of Contents
- 1 Assess Geotechnical Data Requirements
- 2 Calculate Project Load Methodology
- 3 Correlate Soil Bearing Capacity
- 4 Determine Installation Depth Via Torque
- 5 Select Anchor Sizing Configurations
- 6 Verify Coupling And Extension Strength
- 7 Specify Corrosion Protection Standards
- 8 Execute Verification Testing Protocols
- 9 Conclusion
- 10 Frequently Asked Questions
Assess Geotechnical Data Requirements
Accurate geotechnical assessment dictates anchor survival. Engineers must translate raw soil mechanics into precise load paths, accounting for water tables and density metrics before selecting plate configurations.
Utility-grade helical anchors do not perform in a vacuum; their ultimate holding capacity is entirely derived from localized soil mechanics. Before any steel hits the ground, engineers must translate raw geotechnical reports into definitive load parameters. This process requires moving beyond generic lookup tables and directly correlating shear resistance, penetration metrics, and hydrological conditions to your specific site profile. Incorrect translation leads to catastrophic under-design or costly over-engineering. Our field teams consistently see procurement teams waste budget by ignoring effective stress shifts caused by seasonal water tables, while others risk pole line failures by misreading density indices.
Deriving Ultimate Capacity from Soil Shear Strength
Shear strength represents the internal friction and cohesive bonding that prevents soil particles from sliding past one another under load. When a helical anchor engages these layers, the theoretical ultimate capacity is calculated by integrating the resistance across every engaged plate surface. Generic design software often assumes uniform soil strata, which is rarely true in complex utility corridors. We routinely encounter projects where a single soil report masks a sharp transition from dense clay to loose silty sand halfway down the planned embedment depth.
To bridge this gap, designers must isolate the dominant failure plane rather than averaging the entire column. If the shearing zone sits within a high-cohesion layer, the anchor relies heavily on plate bearing area. Conversely, in low-cohesion granular soils, capacity shifts toward frictional drag along the shaft. Accurate derivation demands cross-referencing laboratory triaxial test results with in-situ cone penetration data to map the exact slip surface radius.
- Failure Plane Identification: Pinpoint the exact depth where soil displacement occurs, as capacity drops sharply once the active wedge passes into weaker material.
- Cohesion vs. Friction Balance: Adjust plate diameter and spacing based on whether the dominant soil type provides cohesive grip or granular friction.
- Stratigraphic Layering: Reject flat average values; utilize peak resistance values from the most competent layers within the effective stress zone.
Mapping SPT N-Values to Helix Plate Sizing
The Standard Penetration Test provides a standardized blow-count index that serves as a practical proxy for relative soil density. While laboratory tests offer precision, they are often logistically impossible for widespread grid expansion projects. Engineers leverage these field indices to estimate bearing resistance without expensive drilling campaigns. However, treating density indices as a direct linear multiplier for plate diameter is a common design flaw that compromises structural integrity.
Proper mapping requires understanding the diminishing returns of increased plate area. In highly compacted gravels, excessive diameter creates installation resistance that exceeds available drive torque, leading to premature refusal or shaft buckling. Our engineering reviews frequently show that optimizing the vertical spacing between plates yields better capacity gains than simply increasing individual plate diameters. The goal is to distribute the load across multiple competent strata rather than concentrating it on a single oversized bearing surface.
Accounting for Groundwater Effects on Load Design
Water presence fundamentally alters the mechanical behavior of the surrounding soil matrix. A rising water table reduces effective stress by creating buoyant forces that counteract downward load. For pole line hardware supporting heavy conductors or extreme wind loads, ignoring this hydrostatic shift can result in a significant miscalculation in safe working limits. The soil acts less like a solid foundation and more like a suspended medium, drastically reducing lateral friction and bearing capacity.
Beyond immediate capacity reduction, prolonged saturation introduces long-term reliability threats. Hydrological cycles trigger seasonal swelling in expansive clays and accelerate electrochemical degradation at the steel-soil interface. We mandate rigorous hydrological mapping before finalizing anchor specifications. When high water tables are confirmed, designers must compensate by extending embedment depths into drier strata below the fluctuation zone. Additionally, specifying elevated metallurgical standards becomes non-negotiable to prevent coating breakdown during the multi-decade service life of transmission infrastructure. Our production lines enforce hot-dip galvanizing processes that consistently exceed industry baseline micron thresholds specifically to combat these aggressive hydrological conditions.
- Buoyancy Compensation: Increase total embedment length to offset reduced effective weight and friction losses caused by displaced water volume.
- Seasonal Fluctuation Zones: Place primary load-bearing plates strictly below the maximum recorded historical water level to ensure consistent performance year-round.
- Corrosion Mitigation: Apply reinforced metallurgical barriers to maintain structural continuity in permanently saturated environments where oxygen diffusion accelerates oxidation rates.
| Geotechnical Parameter | Measurement Standard | Engineering Purpose | Design Impact |
|---|---|---|---|
| Soil Classification | ASTM D1586 (SPT N-Value Index) | Load Capacity Calculation | Maps soil N-values to theoretical ultimate holding capacity to select anchor size. |
| Installation Torque | Field Torque Measurement Protocol (Last 3–5 ft) | Field Verification | Validates that theoretical soil capacity matches actual field resistance during installation. |
| Soil Displacement Type | Borehole Log Analysis | Shaft Configuration Selection | Determines suitability of square shafts (high tension) vs. round shafts (lateral stability). |
| Depth to Stable Layer | Soil Stratification Probing | Anchor Length Sizing | Ensures helix plates penetrate below active zones (frost/thaw) into competent strata. |
| Environmental Corrosivity | Soil Resistivity & pH Testing | Service Life Assurance | Dictates required protection levels; standard >85 micron ISO 1461 galvanizing for longevity. |
Calculate Project Load Methodology
Calculated project load methodology requires synthesizing environmental forces with structural safety multipliers to define precise tension thresholds for overhead line infrastructure.
Core Load Aggregation & Vector Resolution
Project load calculation methodology begins with mapping environmental variables to specific structural vectors. Utility engineers must first quantify baseline dead loads, including conductor weight and span length, before layering live loads such as wind pressure and ice accumulation. For standard transmission corridors, design wind pressures typically range between 4 to 6 pounds per square foot (psf), while ice loading scales directly with regional meteorological records.
These forces do not act uniformly. Advanced methodology requires vector resolution to separate horizontal pullout forces from vertical uplift demands. By calculating the angle of the guy wire relative to the pole, engineers can isolate the exact tension component that transfers directly to the anchor point. This step eliminates guesswork, ensuring that the calculated load reflects actual mechanical stress rather than theoretical worst-case scenarios.
Structural Safety Factor Application
Raw calculated tensions must be multiplied by strict structural safety factors to account for material fatigue, dynamic shock loading, and long-term environmental degradation. Industry standards typically mandate a minimum safety multiplier of 1.5x for normal conditions, scaling up to 2.0x in high-wind zones or seismic regions. Applying these factors correctly prevents catastrophic over-engineering while guaranteeing grid resilience during peak storm events.
- Baseline Dead Load: Conductor mass combined with span length determines the static tension threshold before environmental forces are introduced.
- Live Load Multipliers: Wind and ice coefficients are applied dynamically, requiring real-time meteorological data rather than static assumptions.
- Ultimate Tension Demand: The final calculated value after applying vector resolution and safety factors dictates the required hardware breaking strength.
Translating Calculated Loads to Hardware Specifications
Once the ultimate tension demand is established, the calculation methodology shifts toward matching these figures against standardized hardware ratings. Engineers cross-reference the derived load values with published load capacity charts, ensuring that every guy clamp, eye bolt, and anchor component operates within its verified elastic limit. This translation process requires strict adherence to ASTM and ISO testing benchmarks to validate that theoretical calculations align with real-world performance.
Integration With Torque & Installation Parameters
The final phase of the calculation methodology links theoretical load demands to practical installation metrics. For helical square shaft anchors and no-wrench screw variants, engineers must correlate the calculated ultimate tension with specific torque specifications. Higher calculated loads demand precise torque thresholds to achieve full soil engagement without exceeding the yield point of the steel shaft. This correlation ensures that the installed hardware performs exactly as the engineering model predicts.
Correlate Soil Bearing Capacity
Correlating Installation Torque to Soil Bearing Capacity
Soil bearing capacity is not a static catalog value; it is a dynamic field metric verified by correlating installation torque with the specific shear resistance of the strata.
The primary challenge in transmission foundation design is bridging the gap between theoretical geotechnical reports and actual field conditions. While laboratory tests provide estimated shear strengths, the true bearing capacity of a helical anchor is definitively established during installation. As the anchor penetrates the soil, the central steel shaft and welded helical plates generate rotational resistance. This installation torque provides a direct, real-time indication of the load-bearing potential, allowing engineers to verify that the anchor has reached a competent soil strata capable of supporting the required utility loads.
Correlating this torque to holding capacity relies on a proven empirical ratio commonly used in the industry. Standard engineering practice typically applies a capacity multiplier to the final installation torque reading. For instance, a widely accepted benchmark dictates a capacity of approximately 10 pounds for every foot-pound of installation torque. This correlation ensures that the anchor’s ultimate holding strength is predictable and quantifiable before the structure is even erected.
- Torque-to-Capacity Ratio: Industry standards generally correlate 1 foot-pound of installation torque to 10 pounds of ultimate holding capacity (e.g., 2,000 ft-lbs of torque equals 20,000 lbs of holding capacity).
- Shaft Specifications: Torque capacity is heavily influenced by shaft geometry, with square shaft configurations ranging from 1-1/4 inch to 2-1/4 inch providing the structural rigidity necessary for high-torque transmission.
- Helix Plate Sizing: Bearing plates typically range from 6 inches to 14 inches in diameter; larger surface areas engage more soil volume, increasing the torque signature and corresponding load capacity up to 200,000 pounds for heavy-duty configurations.
To achieve accurate correlation, the anchor must penetrate deep enough to bypass loose topsoil and engage stable stratigraphic layers. The system utilizes lead sections with helical plates combined with extension shafts—either plain or helical—to reach these competent bearing strata. When the torque reading stabilizes at the target depth, it confirms that the soil shear resistance is sufficient to transfer the structural load from the pole line hardware into the ground, effectively preventing pull-out failures.
Determine Installation Depth Via Torque
Installation torque is the immediate field proxy for soil shear strength. By monitoring the rotational resistance during installation, contractors can verify that the helix has engaged competent load-bearing strata without waiting for laboratory confirmation.
The Correlation Between Torque and Ultimate Capacity
In helical anchor applications, the relationship between installation torque and holding capacity is generally linear within the same soil stratum. This principle allows project managers to confirm anchor capacity in real-time. As the anchor penetrates the soil, the torque required to rotate the shaft increases. When the torque reading stabilizes at a specific value, it indicates that the helical plates have reached a soil layer with consistent shear strength. This method bypasses the need for extensive guesswork regarding subsurface conditions, provided the torque monitoring equipment is calibrated correctly.
Applying the Torque-to-Capacity Factor (Kt)
- Standard Calculation: If an installation requires 3,000 ft-lbs of torque to reach the target depth, the ultimate capacity may be estimated around 30,000 lbs (assuming a Kt of 10).
- Shaft Considerations: For high-load applications utilizing square shafts ranging from 1-1/4 inch to 2-1/4 inch, this linear relationship typically holds true up to the structural yield of the steel or the shear strength of the soil.
- Helix Diameter Impact: Larger helix diameters (e.g., 10″ to 14″) engage more soil surface area, resulting in higher torque readings at shallower depths compared to smaller plates.
Do not assume that depth alone equals capacity. If torque readings spike suddenly or plateau prematurely, the anchor has likely hit a refusal layer (such as bedrock or dense hardpan) or voids. Continuing to drive past a “refusal” torque can mechanically damage the anchor shaft or coupling without increasing capacity. Conversely, if torque remains low despite increased depth, the anchor is still in weak soil and must be extended deeper until the target torque is achieved.
📋 Field Protocol for Depth Verification
- Step 1: Establish Baseline Torque
Calculate the required installation torque based on the project’s design load (Ultimate Capacity / Kt Factor). - Step 2: Monitor Continuous Torque
Install the anchor while observing the torque meter. Record torque values at 1-foot intervals. - Step 3: Identify Capacity Plateau
Stop installation when the torque reading meets or exceeds the calculated target for a consistent depth (e.g., maintaining target torque over the last 3-4 feet of penetration). - Step 4: Final Average Verification
Use the final average torque reading from the last 3 feet of rotation as the definitive value for capacity verification, ignoring momentary spikes caused by roots or debris.
Select Anchor Sizing Configurations
Correct anchor sizing requires aligning shaft geometry and helix dimensions with projected lateral and uplift loads, rather than defaulting to standard increments.
Matching Shaft Geometry to Projected Loads
Utility contractors frequently over-specify base diameters to compensate for uncertain soil conditions, which unnecessarily inflates material costs and installation torque requirements. The engineering reality dictates that helix plate diameter and shaft profile must scale precisely with calculated load thresholds. For moderate lateral demands in cohesive soils, a 1.25-inch square lead shaft paired with 6-inch bearing plates often delivers optimal resistance without excessive penetration depth.
When projects require capacities exceeding 100,000 pounds, engineers typically step up to 1.75-inch or 2.25-inch shaft profiles alongside expanded helix diameters ranging from 10 to 14 inches. This geometric progression ensures that the steel yield strength does not become the limiting factor before the soil shear capacity is fully mobilized. Plate pitch also plays a critical role; tighter spacing between multiple helices distributes stress more evenly in loose granular strata, whereas widely spaced plates perform better in dense, high-friction soils where single-point bearing is sufficient.
Configuration Selection by Soil and Installation Constraint
Beyond raw capacity, the physical configuration must align with site accessibility and ground composition. Helical designs advance efficiently through varied strata using rotational torque, making them ideal for tight urban corridors or environmentally sensitive zones where vibration-driven displacement is prohibited. In contrast, expanding anchors rely on mechanical wedging against undisturbed soil, which requires higher initial installation force but provides immediate resistance in stable clay layers.
- Torqued Advancement: Requires precise torque-to-capacity correlation monitoring during drive-in to prevent shaft buckling before full embedment.
- Mechanical Expansion: Best suited for predictable vertical loads where rapid deployment outweighs the need for multi-helix stress distribution.
- Cross-Plate Stabilizers: Deployed primarily in highly erodible or washout-prone riverbeds to maximize surface contact area and resist lateral sliding.
Do not select anchor configurations solely based on published maximum load charts. Published ratings assume ideal bearing strata; real-world variability in groundwater tables and soil plasticity often reduces effective capacity by 15 to 25 percent if not properly accounted for during the sizing phase.
Always verify coupling thread engagement length before specifying extension shafts. A mismatched coupling ratio between lead sections and helical extensions creates a stress concentration point that will fail long before reaching the rated anchor capacity under cyclic utility line loading.
| Anchor Configuration | Manufacturing Precision | Surface Protection | Fabrication Method | Quality Assurance |
|---|---|---|---|---|
| Standard Configurations (Helical/Expanding/Cross-Plate/Screw) | Automated (1mm Tolerance) | ISO 1461 (>85 microns) | Cold-Forged Superior Strength | SGS/IEC 120 Load Testing |

Verify Coupling And Extension Strength
Verifying coupling and extension strength mandates confirming mechanical joints sustain ≥95% of parent material yield capacity under static and dynamic loads. Field failures typically stem from improper torque application, inadequate thread engagement, or exceeding installation tension thresholds.
Connection Strength Reduction Variables
Utility engineers frequently encounter unexpected load drops at extension joints when connection geometry deviates from design tolerances. Every threaded or mechanical coupling introduces a potential stress concentration zone where structural continuity is compromised. The primary culprit is insufficient thread engagement depth relative to the shaft diameter.
To eliminate strength reduction, procurement teams must enforce strict dimensional verification before deployment. Manufacturing deviations in pitch diameter or cross-sectional area directly correlate with premature joint fatigue during high-wind or ice-loading events.
- Thread Engagement Ratio: Minimum engagement must equal 1.5 times the nominal diameter to prevent pull-out under peak loading.
- Yield Capacity Retention: Certified couplings must demonstrate ≥95% tensile strength retention relative to the parent steel shaft.
- Surface Finish & Galling Prevention: Rough mating surfaces increase friction coefficients, leading to uneven load distribution and localized yielding during tension application.
Dynamic Tension Limits During Deep Installation
Deep soil penetration generates severe shock loads and torsional resistance that far exceed static design parameters. When hydraulic torque motors drive extensions through compacted clay or dense gravel, instantaneous tension spikes can instantly shear improperly rated couplings. Operators must continuously monitor real-time load cells to prevent exceeding safe dynamic thresholds.
The engineering consensus establishes a hard ceiling for installation dynamics. Maintaining operational tension below critical percentages preserves joint integrity while allowing efficient depth progression without risking catastrophic failure mid-drive.
- Peak Installation Tension: Must not exceed 65% of the coupling’s verified proof load to avoid plastic deformation during driving.
- Torque Transfer Efficiency: Mechanical spline couplings require minimum 85% torque transfer efficiency to prevent rotational slippage in high-friction strata.
- Shock Load Damping: Hydraulic dampers or torque limiters must be calibrated to absorb transient forces exceeding 120% of nominal operating tension.
Verification Protocols & Load Testing Standards
Reliable field performance depends entirely on pre-installation verification procedures. Utility contractors cannot rely solely on manufacturer certificates when deploying critical grid infrastructure across varying geotechnical profiles. Independent proof load testing remains the definitive method for validating coupling integrity before mass deployment.
Testing protocols must simulate worst-case operational scenarios rather than basic static pulls. Applying incremental loads while monitoring elongation provides clear visibility into elastic limits and potential micro-fractures at the extension interface.
- Proof Load Threshold: Joints must withstand 1.5 times the rated working load without permanent set or visible deformation.
- Elongation Monitoring: Acceptable stretch must remain within 0.2% of original length under peak test conditions to ensure elastic recovery.
- Cyclic Fatigue Screening: Extensions subjected to wind-induced vibration require minimum 10,000 load cycles at 50% proof load to validate long-term coupling stability.
Specify Corrosion Protection Standards
Specifying correct corrosion protection requires matching hot-dip galvanizing standards to aggressive soil chemistry. Utility-grade helical anchors demand ISO 1461 compliance with minimum 85-micron coating thickness to prevent premature infrastructure failure.
Aligning Zinc Coating Thickness with Soil Aggressiveness
Procurement orders listing generic “galvanized finishes” routinely result in accelerated fastener degradation and unplanned utility maintenance cycles. The zinc metallurgical bond must fully encapsulate complex geometries like helical plate weld seams and square shaft threads to function correctly.
Engineers must verify mill certification reports confirming a minimum average zinc weight of 610 g/m². This specification directly correlates to the required micron depth across the entire component surface. Matching coating density to local soil resistivity and chloride content eliminates speculative warranty disputes.
- Neutral Soil Profiles: Require a baseline mean thickness of 75 microns to handle standard moisture levels and balanced pH environments.
- High-Moisture/Acidic Ground: Mandate coatings exceeding 85 microns, frequently paired with supplemental polymer topcoats for extended chemical barrier performance.
- Saline & Coastal Infrastructure: Demand rigorous pre-pickling procedures and continuous agitation during immersion to prevent loose zinc ash formation.
Substrate Grade Compatibility and Metallurgical Bonding
Protective coatings fail rapidly when applied to inconsistent steel substrates containing excessive phosphorus or sulfur impurities. High-strength low-alloy (HSLA) steels utilized in power transmission anchors require controlled carbon equivalents to guarantee uniform alloy layer formation during the galvanizing cycle.
The base metal composition dictates how deeply molten zinc diffuses into the surface matrix. Specifying material grades alongside coating requirements prevents suppliers from substituting lower-yield alternatives that cannot withstand heavy installation torque or lateral ground pressure.
Execute Verification Testing Protocols
Verification testing isolates structural integrity from theoretical design, ensuring every anchor meets exact IEC 120 load benchmarks before field deployment.
Applying Proof Load Factors to Rated Capacity
Proof load testing validates that manufactured hardware withstands forces significantly beyond normal operational limits without permanent failure. In utility grid applications, engineers typically apply a safety factor between 1.5 and 2.0 times the rated working capacity during factory validation. This multiplier accounts for transient wind loads, ice accumulation, and emergency fault currents that pole lines routinely experience.
Our engineering team strictly adheres to this multiplier during our in-house IEC 120 gauge testing. We do not rely on generic torque-to-capacity estimations, which fluctuate wildly across different soil compositions. Instead, we apply direct axial tension to calibrated grips until the target proof load is reached, recording the exact yield point. This methodology guarantees that a component rated for 45 kips will demonstrably hold that load under controlled laboratory conditions.
Monitoring Creep Displacement During Sustained Loading
Creep refers to the slow, progressive deformation of metal components when subjected to a constant tensile or compressive force over an extended period. While immediate structural failure is obvious, undetected micro-slip or creep in anchor shafts and coupling threads can lead to gradual line sagging or pole lean months after installation.
During sustained loading protocols, we track displacement rates at 15-minute intervals. Acceptable performance requires the deformation rate to stabilize near zero within the first hour of load application. If displacement continues to accumulate linearly, the material has either exceeded its proportional limit or contains manufacturing flaws in the forging grain structure. Our automated testing rigs log these curves automatically, flagging any unit that exhibits non-linear creep behavior before it clears the production line.
Acceptance Criteria for Elastic vs. Plastic Deformation
Distinguishing between elastic and plastic deformation is the primary gatekeeper for product acceptance. Elastic deformation represents temporary stretching that fully recovers once the test load is removed, while plastic deformation indicates permanent structural alteration. For transmission hardware, the allowable threshold for permanent set is typically capped at 0.1% to 0.2% of the original gauge length.
- Elastic Recovery Threshold: Upon unloading from proof load, measured elongation must return to within 99.8% of the pre-test baseline dimension.
- Plastic Deformation Limit: Any visible necking, permanent bend exceeding 0.1%, or thread stripping results in immediate lot rejection.
- Load Retention Requirement: The component must sustain the full rated proof load for a minimum of 60 seconds without load cell drift exceeding 5%.
Validating elastic recovery thresholds requires strict adherence to proven metallurgical processes. We utilize hot-forging rather than traditional casting, which delivers superior strength and precision through optimized internal metal flow. This manufacturing approach ensures components consistently pass the elastic recovery benchmark. Our dedicated 10-person inspection team manages a 100% double-review QC protocol to verify load ratings and coating integrity before packaging. Every batch undergoes SGS verification to confirm that these deformation limits align with your regional utility compliance standards.
Conclusion
Successful tieback design relies on precise soil interpretation rather than guesswork. You must map SPT N-values to helix plate sizing to ensure the system handles tension. Torque monitoring during installation provides the real-world verification needed to confirm that theoretical capacity matches actual ground conditions. Ignore soil mechanics, and the entire grid stability fails.
- Verify all anchors meet ASTM A123 hot-dip galvanizing standards to prevent corrosion failure in aggressive soils.
- Apply proof load factors to rated capacity and strictly monitor for creep displacement during sustained loading tests.
- Consult our Rax Power engineering team to review your specific soil bearing calculations and torque specifications. We help validate configurations before you order materials.
Frequently Asked Questions
Are custom shaft and helix sizes available?
Manufacturers routinely accommodate non-standard dimensions to meet specific project load requirements or unique soil profiles. Custom helix diameters, plate counts, and shaft lengths can be engineered through dedicated mold development processes. While standard catalogs cover most utility applications, specialized configurations require advanced planning to align with production schedules. Early consultation ensures optimal structural performance without compromising installation efficiency.
Is grout curing required before loading?
Grout curing is generally unnecessary for standard helical tieback anchors since they rely on direct soil-to-helix friction rather than bond strength. Loading can typically commence immediately after installation reaches the target torque value. However, specific geotechnical requirements or specialized soil stabilization projects may occasionally mandate a short curing period. Always verify local engineering specifications before applying design loads.
Which drilling equipment handles installation?
Hydraulic rotary drives mounted on excavators or skid steers are the industry standard for installing helical tiebacks efficiently. These power heads deliver consistent torque while allowing precise depth control and real-time monitoring. For smaller diameter applications, manual or portable electric drivers may suffice. Equipment selection should always align with the required installation torque and ground conditions.
Can anchors install in confined workspaces?
Yes, helical anchors are specifically designed for installation in tight or restricted areas due to their compact driving mechanism. Standard hydraulic rotary drives can operate with minimal swing radius, allowing placement near existing structures or underground utilities. Careful equipment selection ensures safe maneuverability without requiring extensive excavation space. Proper site assessment remains essential to maintain clearance margins during operation.
Does Raxpower provide SGS testing reports?
Yes, comprehensive SGS certification documents accompany all verified production batches to guarantee international compliance. Each unit undergoes mandatory in-house IEC 120 load testing alongside double-review quality inspections before shipment. These documented protocols validate structural integrity and coating durability against global utility standards. Buyers receive full traceability records supporting engineering approvals and project audits.