
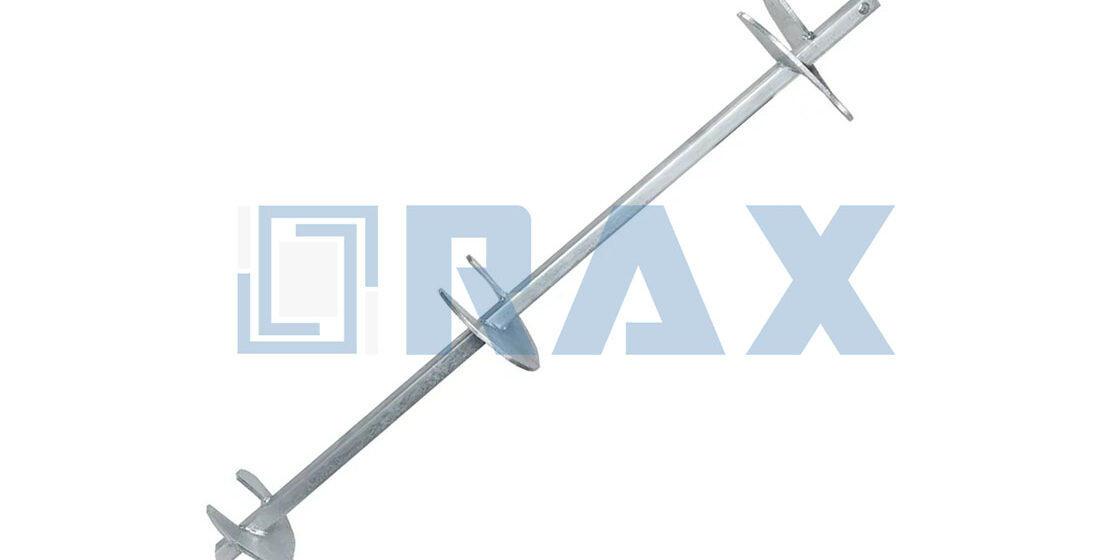
Predicting the ultimate holding strength of helical anchors requires a rigorous analysis of the interplay between shaft geometry and subsurface soil mechanics. Empirical field data reveals that anchor performance can vary by orders of magnitude depending on soil classification and composition. The Golden Data illustrates this variability vividly: a standard 6-inch helix achieves an ultimate capacity of 6,500 pounds in Class 5 soil, yet the identical configuration yields merely 1,000 pounds in Class 8 conditions—a reduction exceeding 84% driven solely by differences in the subsurface profile. Such stark divergence demonstrates why theoretical models, absent field-validated empirical input, cannot reliably predict capacity across the full spectrum of installation environments.
Interpreting Manufacturer Torque-to-Capacity Ratios
The relationship between installation torque and ultimate capacity relies on empirical K-values that fluctuate wildly based on shaft geometry and soil heterogeneity; blind reliance on generic theoretical tables without field validation is a primary cause of structural overestimation.
Correlating K-Values with ASTM D1586 Soil Profiles
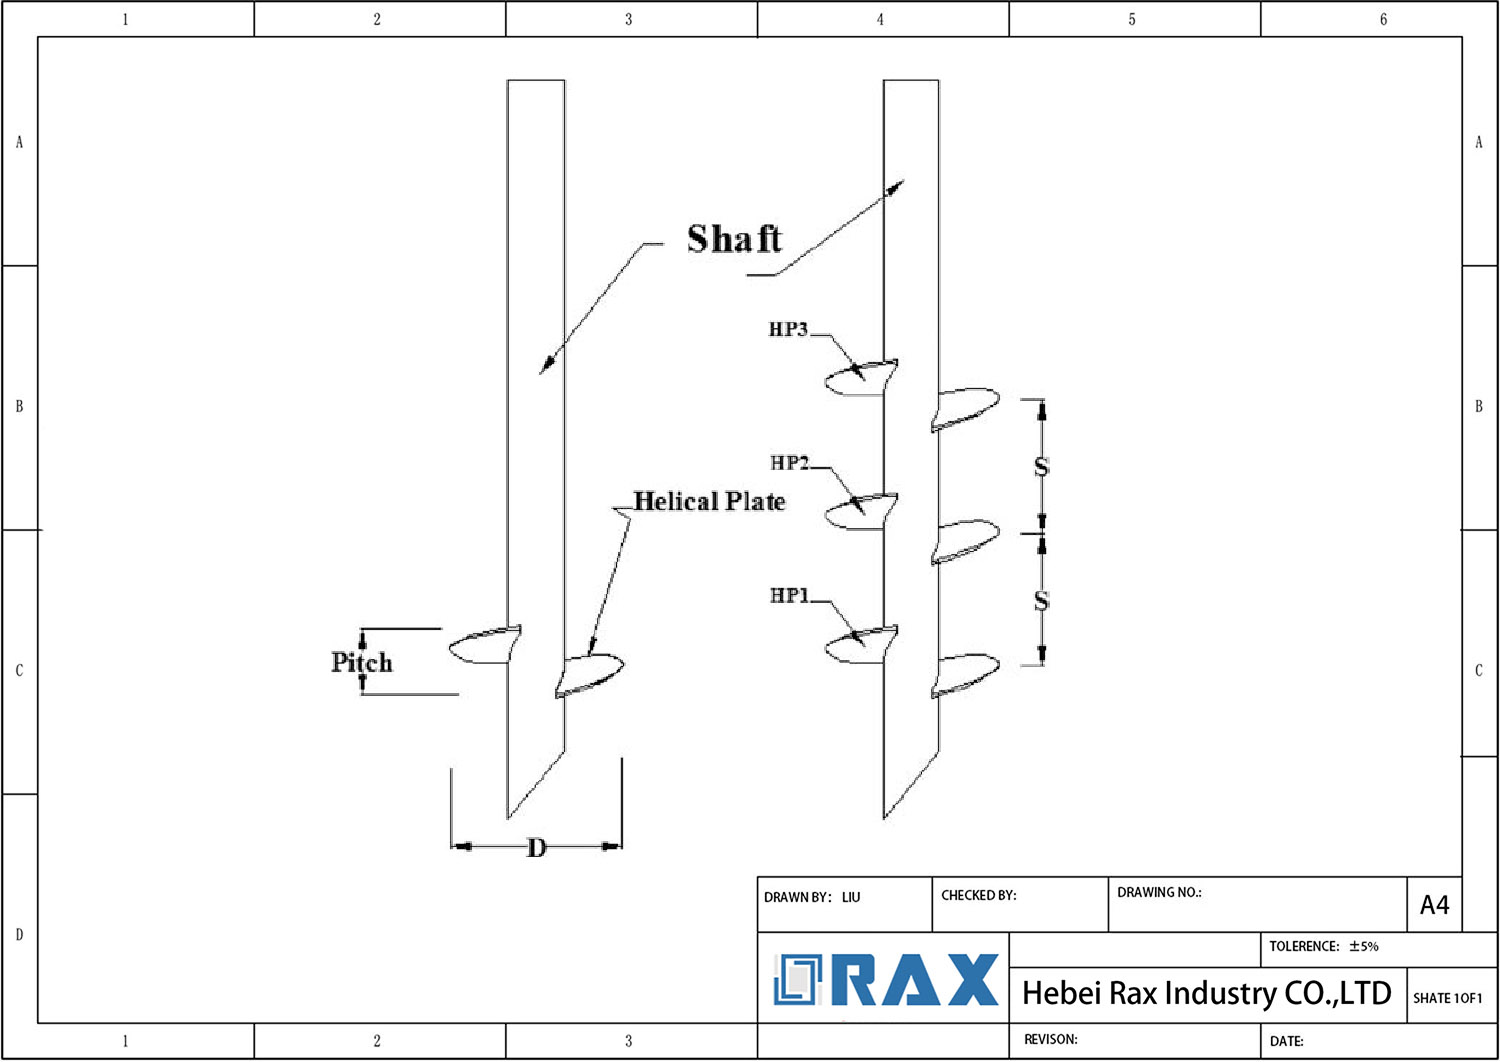
The K-value is not a universal constant; it is highly dependent on the mechanical interaction between the helix configuration and the specific soil stratum. Round shaft anchors generally register higher installation torque compared to square shaft variants of identical helix diameter, as the continuous pipe surface engages more soil during advancement. When comparing theoretical torque capacity tables against ASTM D1586 Standard Penetration Test (SPT) blow counts, engineers frequently identify discrepancies. While SPT provides macro-level soil profiling at discrete intervals, continuous torque monitoring offers real-time profiling of soil density. Mismatches often occur in dense, non-cohesive sands where SPT sampling suffers from disturbance, whereas torque readings accurately reflect true in-situ resistance.
Torsional Yield Limits of 3/4″, 1″, and 1-1/4″ Square Shafts
Pushing a helical anchor to achieve a target ultimate capacity requires applying maximum installation torque, which directly threatens the structural integrity of the central shaft. For common square shaft profiles—3/4″, 1″, and 1-1/4″—torsional yield limits dictate the maximum depth and bearing capacity achievable before the steel begins to physically twist. Exceeding this threshold permanently deforms the shaft, destroying the empirical K-value correlation and rendering the anchor useless.
We frequently see catastrophic torsional failures in the field when inferior cast anchors are subjected to the high-torque environments required for dense bearing strata. Sand casting inherently introduces microscopic voids and inconsistent wall thickness, creating unpredictable weak points along the shaft. To eliminate this risk, we manufacture our triple eye rods and critical shaft components using hot-forging technology. By compressing the steel’s grain structure, we remove all internal casting voids, dramatically increasing the torsional yield strength and the ultimate breaking load limit of the assembly.
Calculating Target Installation Torque
To achieve a specific target ultimate capacity, the required installation torque is calculated by reversing the standard capacity-to-torque equation—dividing the target capacity by the site-specific K-value. If real-time torque readings plateau below the calculated threshold, engineers must adapt by extending the shaft depth or upsizing the helix plates to engage denser soils. Predictable torque calculations demand absolute dimensional precision in the anchor geometry itself.
When calculating the precise torque needed for utility infrastructure across varying global soil profiles, even a fraction of a millimeter of variance in helix pitch or shaft diameter will cause actual field torque to deviate from theoretical models. That is why we maintain a strict 1mm dimensional tolerance across our automated production runs. Combined with our rigorous double-review quality protocol, we ensure that every high-volume batch of anchors exhibits repeatable torque resistance, allowing field engineers to rely on their capacity calculations without questioning the consistency of the hardware.
Mechanical performance specifications are strictly categorized by shaft diameter to prevent structural yielding during installation. Typical working torque limits are as follows:
- 3/4″ rods: 400 ft-lbs
- 1″ rods: 1,000 ft-lbs
- 1-1/4″ rods: 2,300 ft-lbs
These thresholds underscore why dimensional tolerance control is paramount—each diameter is engineered to a specific torque envelope, and any manufacturing variance risks pushing the assembly beyond its calibrated limits before the intended safety factor is ever applied.
Establishing Safety Factors and Code Compliance
Safety factors are the non-negotiable mathematical buffer between operational stress and catastrophic failure, strictly governed by IBC codes and geotechnical realities rather than guesswork.
Defining Factor of Safety (FOS) per IBC and Local Codes
The International Building Code (IBC) and local utility standards typically mandate a minimum Factor of Safety (FOS) of 2.0 for permanent anchorage systems. This ratio is derived by dividing the Ultimate Bearing Capacity—the load at which the anchor system experiences structural or geotechnical failure—by the anticipated maximum working load. For critical infrastructure or temporary applications, this factor may be adjusted upward, but a 2.0 FOS remains the industry baseline for balancing material economy with risk mitigation.
Allowable Working Capacity vs. Ultimate Failure Loads
Engineers must strictly distinguish between the Absolute Ultimate Limit State (ULS) and the Serviceability Limit State (SLS). The Ultimate Failure Load represents the peak stress the anchor assembly can withstand before physical collapse, while the Allowable Working Capacity is the conservative limit designated for daily operation. Confusing these two figures creates a critical vulnerability; specifying an anchor based on its ultimate strength without applying the required safety factor leads to immediate non-compliance and high risk of failure under load.
Incorporating Seismic and Wind Load Variables
Static load calculations are insufficient for regions prone to high-velocity winds or seismic activity. Design specifications must integrate dynamic load coefficients that account for the sudden energy spikes associated with these events. These transient forces generate cyclic loading that can fatigue hardware over time, requiring not just a higher FOS but also specific material toughness to absorb shock without brittle fracture.
Setting Displacement Thresholds for Creep and Deformation
Code compliance extends beyond tensile strength to include movement limitations. Acceptance criteria must define strict displacement thresholds for both elastic deformation and long-term creep. Elastic deformation is the immediate, recoverable movement under load, while creep represents progressive, non-recoverable settlement in the soil structure over time. Exceeding these thresholds can compromise the alignment of connected tension members and pole stability.
We mitigate hardware variability by maintaining automated production with a strict 1mm dimensional tolerance. By ensuring the mechanical components are manufactured to precise micron-level accuracy, we eliminate hardware deflection as a variable in displacement testing, ensuring that any observed movement is purely geotechnical and compliant with your design specifications.
Static Axial Load Testing Procedures
Static axial load testing remains the gold standard for verifying helical anchor holding capacity, physically validating displacement limits and creep thresholds that theoretical torque-to-capacity ratios cannot guarantee.
Engineers frequently specify helical anchors based on standard torque correlation methods, assuming theoretical K-values perfectly equate to field capacity. This assumption creates massive liability. Torque monitoring only indicates soil consistency during installation; it does not account for time-dependent soil setup, remolding in cohesive clays, or mechanical relaxation. Static axial load testing bridges the gap between theoretical design loads and actual physical performance.
Interpreting Failure and Displacement Acceptance Criteria
Interpreting load test data requires strict adherence to mechanical thresholds rather than waiting for catastrophic physical pullout. A test is considered failed long before the anchor yanks out of the ground. Failure is officially defined by exceeding specific total displacement limits or failing to stabilize under a constant load. Misinterpreting these creep variables causes unnecessary scrapping of compliant inventory or, worse, the approval of compromised foundation systems.
📋 Actionable Steps
- Step 1: Pre-load and Stabilize: Apply an initial axial load equal to 5% to 10% of the designated design working load to seat the bearing plates and eliminate mechanical slack in the testing apparatus.
- Step 2: Incremental Loading: Progressively apply the axial load in 25% intervals of the design working load. Hold each increment for a minimum of 4 to 10 minutes to monitor displacement rates.
- Step 3: Creep Testing: At 100% (and up to 200% for proof tests) of the design working load, maintain the load and record displacement readings at specific intervals (1, 2, 3, 4, 5, 10, and 15 minutes). If the displacement exceeds 0.05 inches between log time intervals, extend the hold until creep stabilizes.
- Step 4: Elastic Recovery: Gradually release the load in decrements to measure the rebound curve. A high percentage of elastic recovery indicates the anchor is functioning within its structural limits, while excessive plastic deformation suggests yielding.
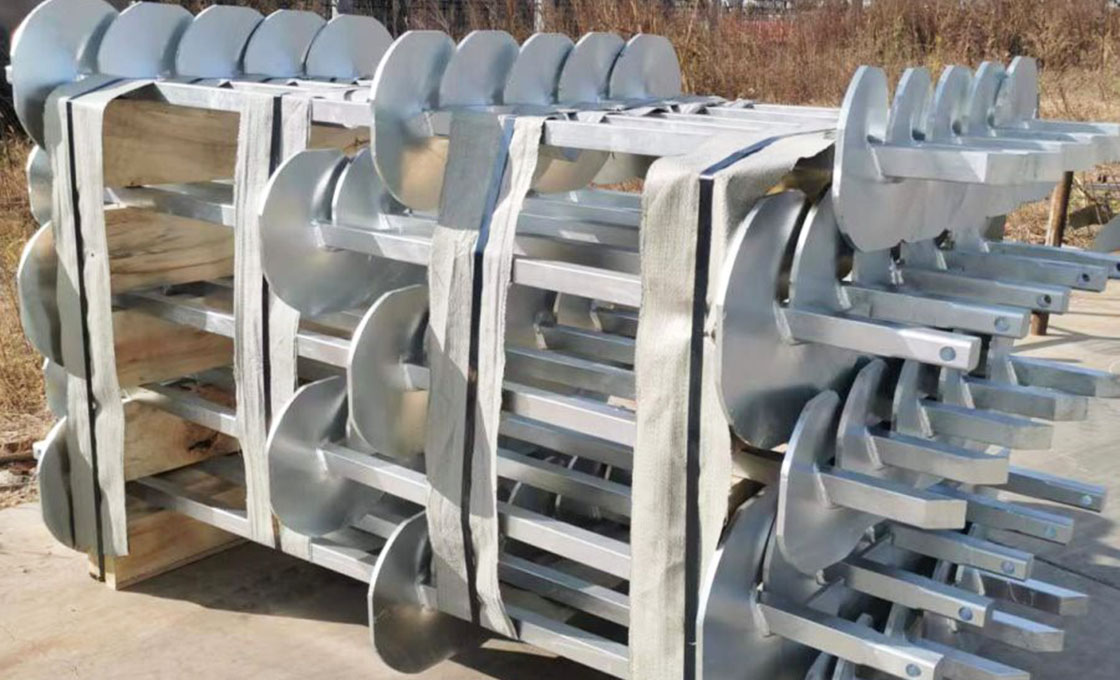
To eliminate this field failure mode, we manufacture our high-strength anchor assemblies and triple eye rods using precision hot-forging technology rather than traditional sand casting. Hot-forging compacts the steel’s molecular structure, entirely eliminating internal cavities and significantly elevating the breaking load limit. This structural integrity is verified right on our factory floor. Our 10-person QC team executes a strict double-review process, subjecting production runs to rigorous in-house load testing per IEC 120 standards. By validating the physical breaking limits before galvanizing and packaging, we ensure B2B distributors receive hardware that survives peak static axial load conditions without sudden shear failure.
Lateral Load Testing Methodologies
Validating lateral load capacity requires a high-precision hydraulic jack and strict displacement monitoring to distinguish between acceptable elastic deflection and irreversible soil-structure failure.
Lateral load testing evaluates an anchor’s resistance to transverse forces by applying horizontal pressure rather than axial pull. This is achieved using a calibrated center hole ram positioned between the helical pile head and a stable reaction mass. By rigorously controlling the hydraulic fluid within the jack system, technicians apply force in specific, incremental steps rather than a continuous surge, ensuring accurate measurement of soil shear resistance and structural bending limits.
Standard Lateral Load Test Procedure
📋 Actionable Steps
- Step 1: Position the calibrated hydraulic jack horizontally between the anchor head and a structurally sound reaction mass capable of withstanding the maximum test load.
- Step 2: Apply the lateral load in predetermined increments, immediately recording the anchor movement after each increment stabilizes.
- Step 3: Progressively increase the load up to the maximum test load (typically 1.25x the design load), ensuring no hydraulic surging occurs during the transitions.
- Step 4: Maintain the maximum load for a minimum of 10 minutes, recording displacement readings at 0.5, 1, 2, 3, 4, 5, 6, and 10-minute intervals to analyze creep behavior.
- Step 5: Unload the system incrementally and record the rebound curve to determine the elastic recovery of the shaft and surrounding soil matrix.
Proof Testing vs. Ultimate Capacity
Proof testing confirms a hardware component functions elastically under anticipated loads without permanent deformation, whereas ultimate capacity defines the absolute threshold for catastrophic failure or rupture.
Engineering Realities of Proof vs. Ultimate Limits
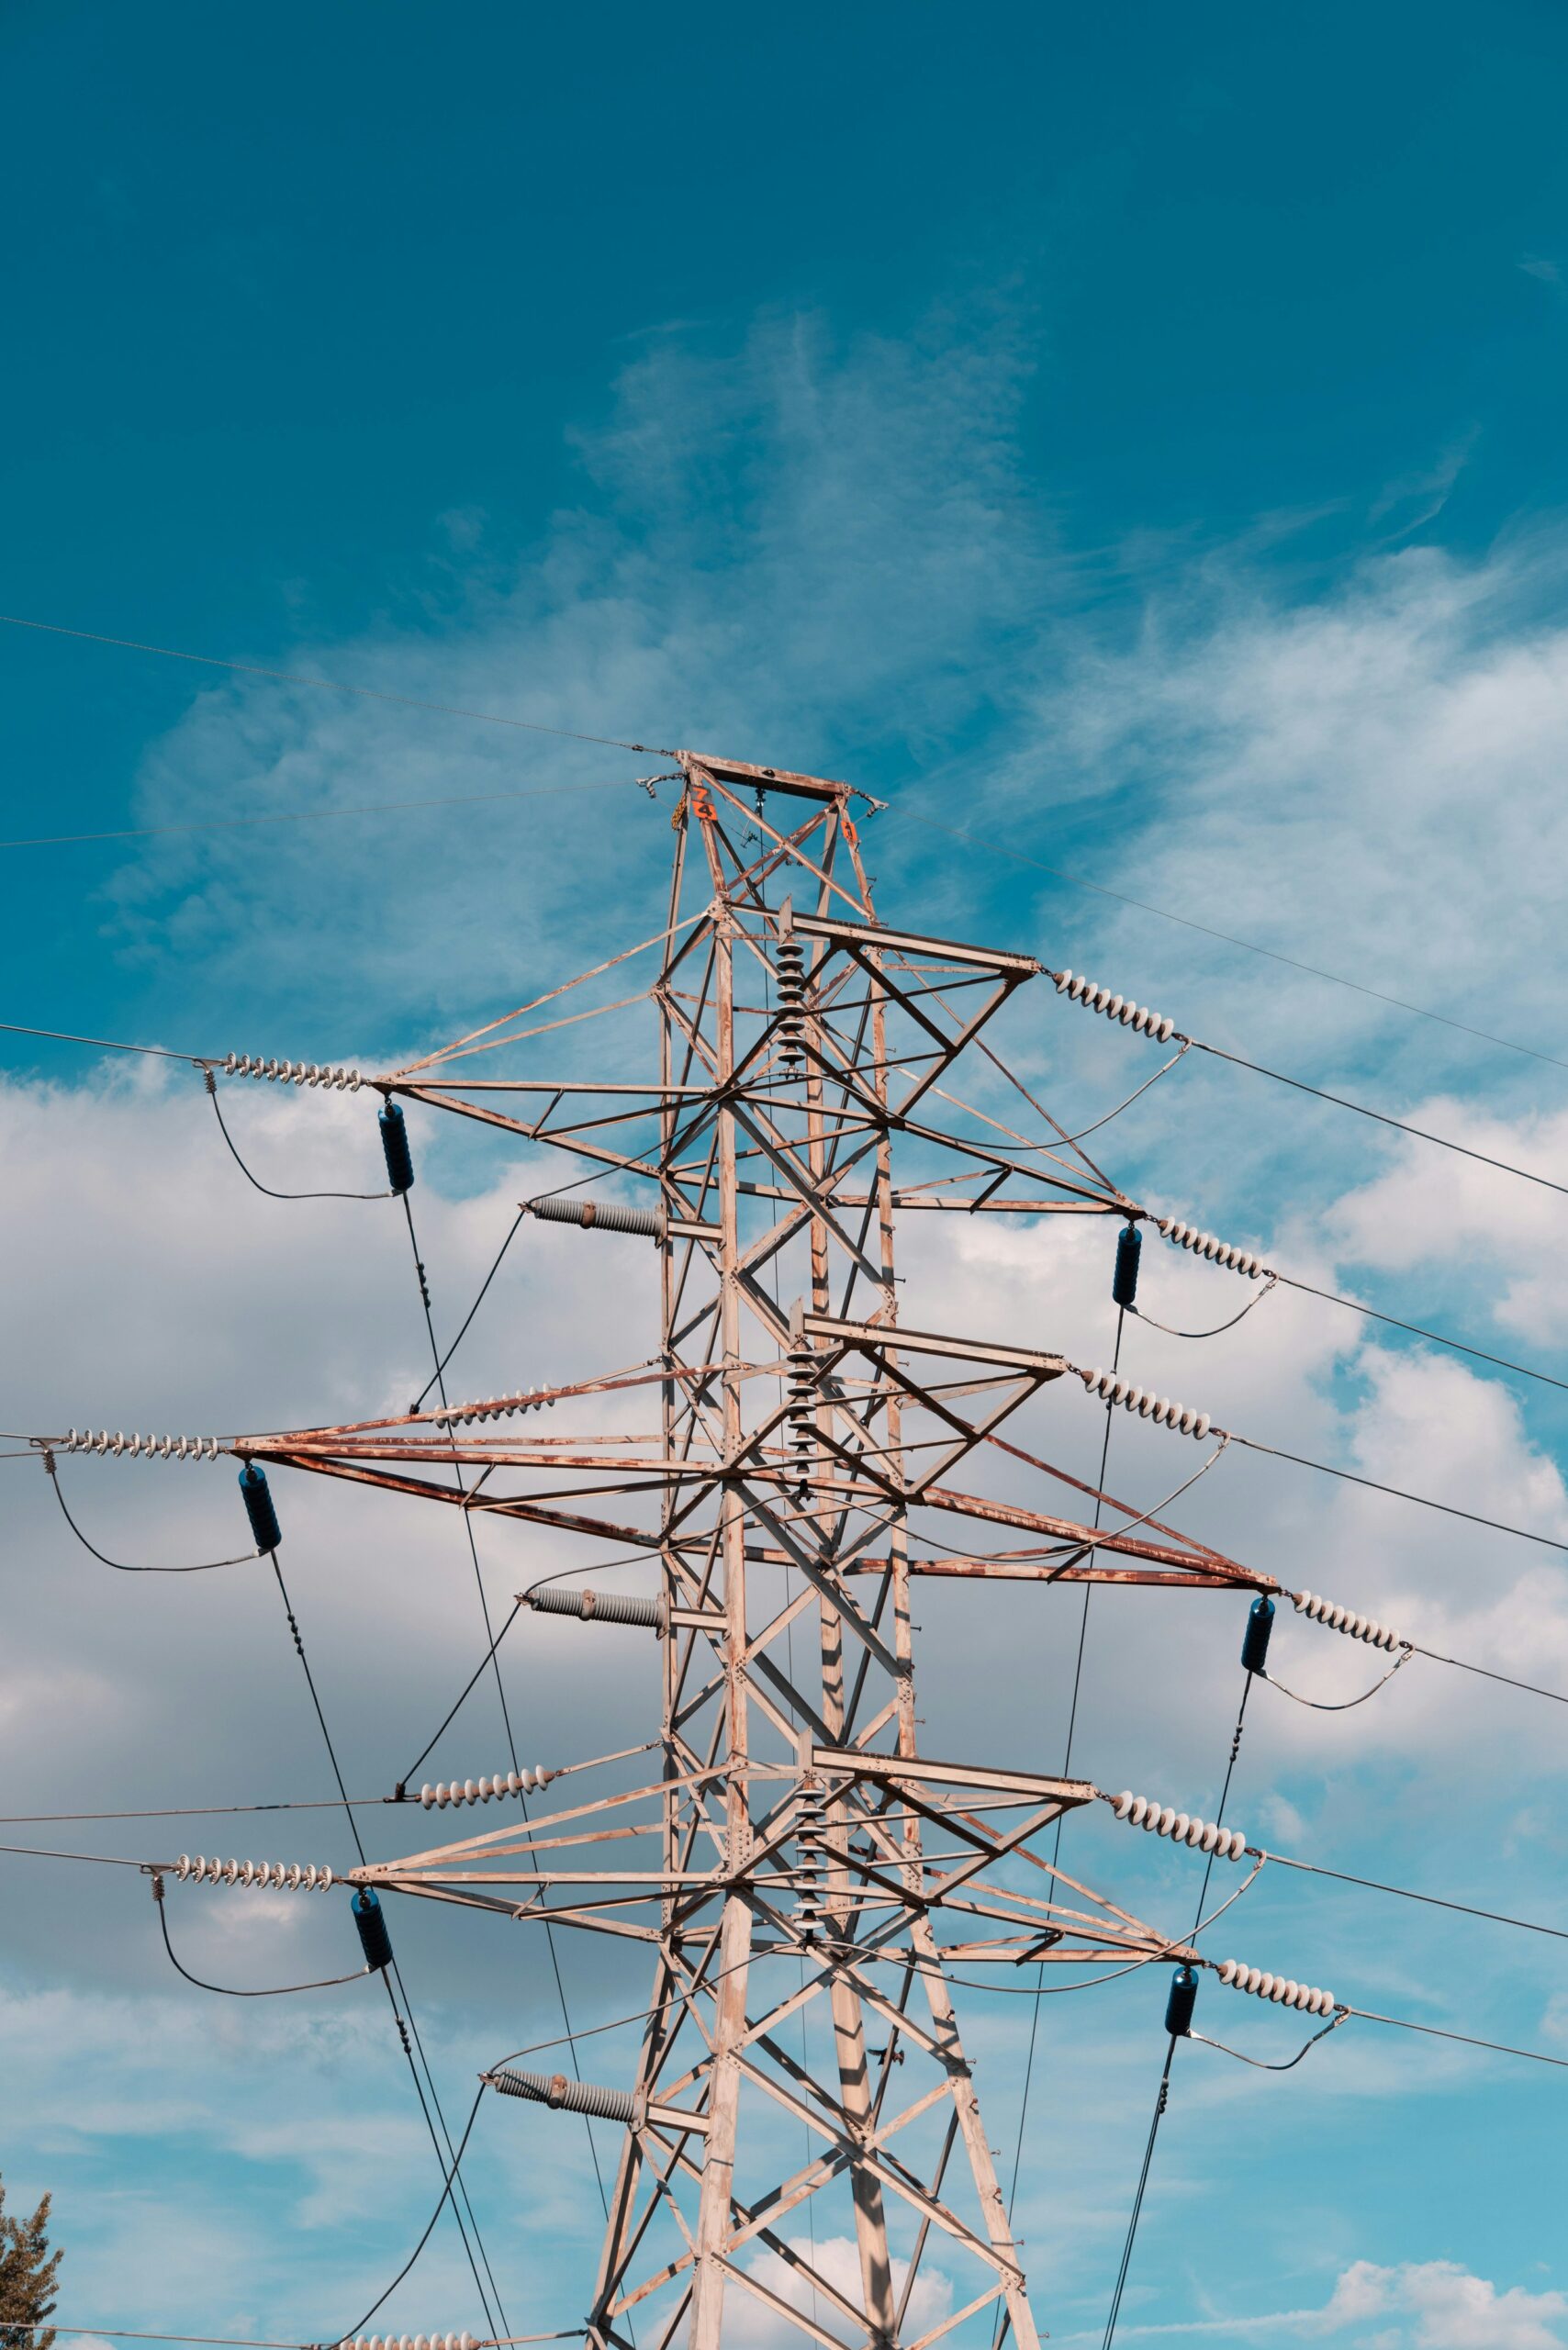
In transmission infrastructure, proof testing typically represents a designated percentage of the ultimate breaking load. This procedure validates that the component operates within the proportional limit, recovering fully upon load release without yielding. Conversely, the ultimate capacity dictates the maximum stress the material withstands before structural rupture. Engineers rely heavily on this breaking load threshold to establish an appropriate Factor of Safety (FOS). When procurement teams conflate these two metrics—interpreting a proof load as the ultimate limit—they fundamentally erase the engineered safety margin, predisposing the grid assembly to sudden failure during peak environmental loading or seismic events.
Dimensional Precision and Load Verification
Beyond material composition, the reliability of proof testing data is directly proportional to the geometric accuracy of the hardware. If a component features inconsistent dimensional tolerances, it risks generating asymmetric load paths during a tension test. Off-axis loading induces localized stress concentrations, meaning a component might fail a proof test not due to inadequate material strength, but because of poor mechanical symmetry. By enforcing strict automated dimensional controls during production, manufacturers ensure that the applied proof load accurately reflects pure axial or shear stress, validating the true structural integrity of the design.
| Parameter | Proof Testing | Ultimate Capacity |
|---|---|---|
| Testing Standards | Rigorous in-house load testing per IEC 120 standards | Breaking load limits verified to exceed theoretical design specifications |
| Structural Integrity | 100% double-review process executed by dedicated 10-person QC team | Hot-forging technology eliminates structural voids (vs. sand casting) for maximum strength |
| Dimensional Precision | Strict enforcement of 1mm dimensional tolerances via advanced automation | Precision engineering ensures optimal stress distribution under peak loads |
| Durability & Finish | Full SGS verification and ISO 1461 compliance checks | Hot-dip galvanizing exceeding 85 microns (ASTM A153 Class C) ensures long-term corrosion resistance |

Resolving Spec-to-Field Data Discrepancies
Spec-to-field data discrepancies in pole line hardware typically stem from three controllable manufacturing variables: dimensional drift during bulk production, hidden casting voids in load-critical components, and inconsistent zinc coating metallurgy. Resolving them requires eliminating variance at the forge—not inspecting it out at the end of the line.
When field engineers measure a breaking load that falls 15-20% below the manufacturer’s published ultimate strength, the instinct is to blame the test setup or soil conditions. In reality, the discrepancy often originates upstream: shaft diameters rolled to the lower tolerance limit, eye heads cast with internal porosity, or zinc coatings applied below the corrosion-protection threshold specified in the tender documents. These deviations compound under load.
Material Integrity: Forged vs. Cast Load-Critical Components
The most dangerous spec-to-field gap appears in triple eye rods and anchoring hardware where breaking load is mission-critical. Traditional sand casting leaves microscopic voids and gas porosity inside the eye head—defects invisible to visual inspection but catastrophic under axial tension. A catalog may claim an ultimate breaking load of 200 kN, but a single internal void concentration can reduce actual field performance by 18-25%, particularly in low-temperature environments where metal embrittlement accelerates crack propagation from those voids.
Dimensional Tolerance Control in High-Volume Production
Catalog specifications assume nominal dimensions. Field reality exposes the tolerance stack. A U-bolt shank diameter specified at 20mm ±0.5mm sounds tight, but on semi-manual production lines running 10,000+ units, drift toward the lower limit is common—and every 0.2mm reduction in shank cross-section directly reduces the effective shear area and ultimate load capacity. Thread engagement depth, eye bore concentricity, and cross-arm flatness all follow the same erosion pattern under volume pressure.
Our automated production lines hold a strict 1mm tolerance on structural components like steel cross arms and alley braces. This precision matters because dimensional variance in cross-arm bolt-hole positioning creates misalignment during tower assembly, forcing field crews to oval-out holes or use undersized bolts—both of which compromise the structural integrity calculated during the design phase. When the installed hardware deviates from the engineering model, every downstream load assumption becomes unreliable.
Zinc Coating Thickness: The Invisible Spec Drift
Galvanizing specifications frequently cite ISO 1461 as compliance evidence, but the standard defines minimum mean coating thicknesses that vary by material thickness class. A supplier can technically meet ISO 1461 while delivering a mean coating of 70 microns on a component where the tender specified 85 microns minimum for aggressive coastal environments. This 15-micron gap translates to a 3-5 year reduction in service life—discrepancy that won’t appear in acceptance testing but will surface as premature corrosion failures during the warranty period.
We mandate a mean hot-dip galvanizing thickness exceeding 85 microns across our hardware range, verified through our double-review inspection protocol. Coating thickness is measured at multiple points per batch using magnetic gauge testing, and the data is archived per batch number for traceability. For projects specifying ASTM A153 Class C compliance, we calibrate our galvanizing kettle temperature and immersion time to achieve the heavier coating deposits that standard demands.
Pre-Shipment Verification: Closing the Spec-to-Field Loop
The most effective way to resolve spec-to-field discrepancies is to catch them before they leave the factory. Relying on a single final inspection is insufficient—sampling plans like ISO 2859-1 (AQL) accept a defined percentage of defective units within a batch. For critical hardware, that acceptance threshold is unacceptable.
📋 Actionable Steps
- Step 1: Verify dimensional accuracy via gauge testing per IEC 120 on the first article from each production run, not just the final batch sample
- Step 2: Conduct in-house load testing on specimens pulled from the beginning, middle, and end of each production run to detect drift
- Step 3: Execute 100% visual and dimensional double-review—every unit inspected twice by independent QC personnel before packaging
- Step 4: Archive test data with batch traceability so any field discrepancy can be traced back to the specific production parameters and raw material lot
- Step 5: Request SGS verification certificates for the specific batch being shipped, not generic annual compliance documents
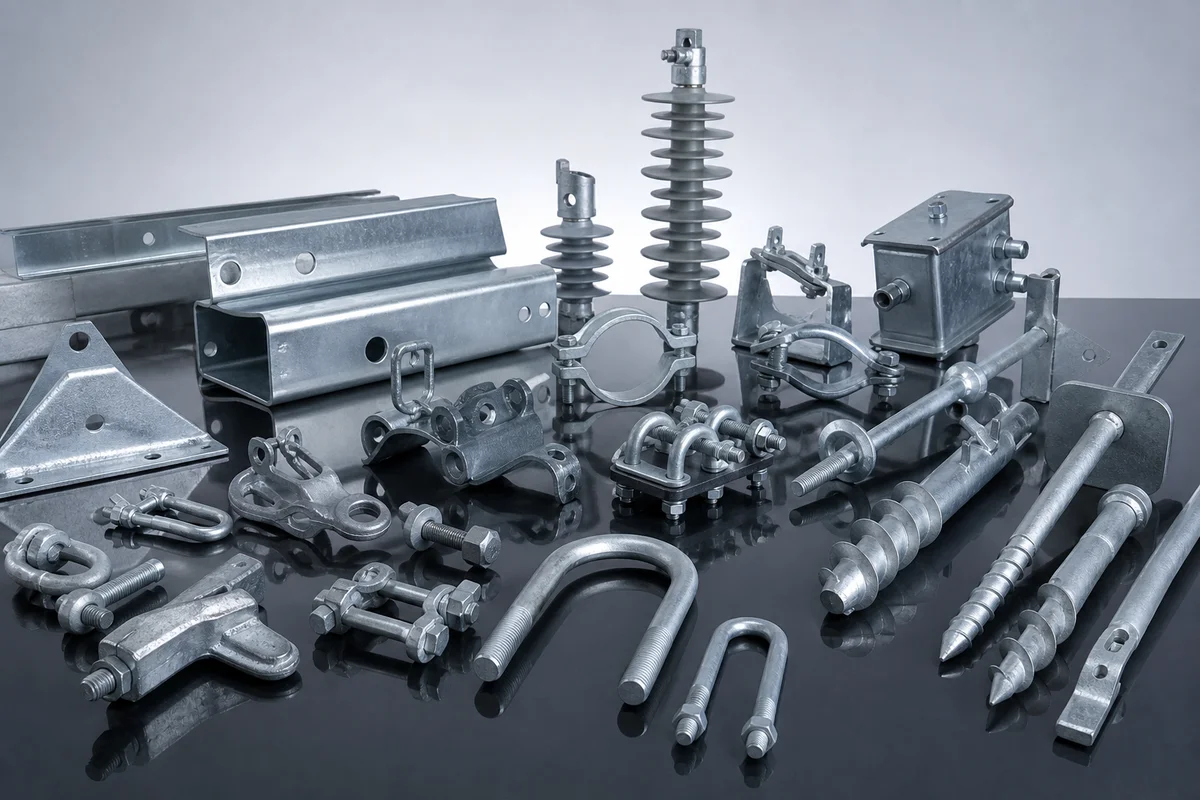
Our 10-person dedicated QC team executes this double-review protocol on every shipment. The discipline of inspecting 100% of products twice—once after primary forming and again after galvanizing—catches dimensional shifts, coating thin spots, and thread defects that single-pass inspection misses. For OEM/ODM orders where custom specifications deviate from our standard catalog, the protocol intensifies: first-article inspection reports are generated and approved before production scaling begins, ensuring the custom geometry meets the engineer’s design intent before 5,000 units are committed.
Engineering Sign-off Acceptance Criteria
Engineering sign-off is not a formality—it is a binary pass/fail gate. If the acceptance criteria are not explicitly defined by hard numbers (tolerance, coating thickness, breaking load) before the PO is issued, the project is already at risk of rejection at the receiving dock.
Dimensional Tolerance: The First Rejection Trigger
Field inspectors rarely reject anchors for catastrophic failure; they reject them for dimensional non-conformance. Bolt hole diameters, shaft straightness, and helix pitch that deviate from drawing tolerances will trigger a failed sign-off under standard utility inspection protocols. Many manufacturers operate with loose 2-3mm variances on cross-arm and anchor brackets, which causes fit-up failures during tower assembly and immediately invalidates the acceptance certificate.
In our facility, automated machining holds a strict ±1mm tolerance on all alley arms, braces, and structural brackets. This precision is not a marketing claim—it is a non-negotiable requirement for passing receiving inspection on international utility tenders, particularly in South American and Southeast Asian markets where gauge-based dimensional checks are aggressive.
Galvanizing Coating Acceptance Thresholds
Hot-dip galvanizing is the most common reason for batch rejection at engineering sign-off. Inspectors verify coating thickness against ISO 1461 or ASTM A153 Class C, depending on the material class. A reading below the minimum specified micron level on any single test point is grounds for rejecting the entire lot. Vague manufacturer claims of ‘heavy galvanizing’ are insufficient—only a mean thickness value with a documented measurement protocol will pass audit.
Mechanical Load Acceptance Verification
Acceptance of breaking load requires documented test data generated under recognized standards. For pole line hardware and preformed grips, IEC 120 governs the mechanical testing methodology. The acceptance packet must include the load curve, the ultimate failure point, and the gauge measurements taken at specified intervals. Without this data set, the engineer of record cannot legally sign off on the installation.
Required Documentation Package for Sign-Off
A compliant acceptance package must accompany every shipment. Missing or incomplete documentation is a logistical failure that halts sign-off regardless of the physical product quality. The package should contain mill test certificates (MTC), galvanizing thickness reports, dimensional inspection logs, IEC 120 load test results, and the SGS verification certificate. Any gap in this chain forces the project engineer to request re-testing, which delays commissioning by weeks.
📋 Actionable Steps
- Step 1: Mill Test Certificate (EN 10204 3.1 or 3.2) confirming raw material chemical composition and mechanical properties.
- Step 2: Hot-dip galvanizing thickness report with mean micron values mapped to ISO 1461 or ASTM A153 Class C class requirements.
- Step 3: Dimensional inspection log verifying critical dimensions within ±1mm tolerance against the approved drawing.
- Step 4: IEC 120 mechanical load test report demonstrating ultimate breaking load exceeds the specified design factor.
- Step 5: Third-party SGS verification certificate confirming batch compliance with the contracted technical specification.
Documenting Soil Disturbance Effects
Even with precision-forged helical plates and ideal installation practices, the mechanical act of advancing an anchor fundamentally remolds the surrounding soil matrix, directly dictating the true holding capacity rather than theoretical baseline values.
Assessing Soil Remolding and Sensitivity in Cohesive Clay Deposits
In saturated cohesive clays, the rotation of helical bearing plates induces structural remolding along the installation path. This mechanical disturbance directly reduces the undrained shear strength of the clay, a factor recognized in geotechnical engineering since the 1950s. Field vane tests confirm that even under high-quality installation methods, the localized soil strength drops below the peak undrained strength of the adjacent undisturbed ground. Engineers must therefore apply an Installation Disturbance Factor to account for this shear strength degradation during capacity calculations.
From a hardware perspective, ensuring precise helix geometry minimizes excessive soil drag during rotation. At Rax Power, we utilize automated and semi-automatic machinery to guarantee a strict 1mm tolerance on our helical anchor profiles. This high-precision geometry ensures uniform soil engagement and limits over-excavation compared to rough-cast alternatives, mitigating the severity of structural disturbance in sensitive clay profiles.
Adjusting Capacity Estimates for Installation Disturbance in Loose Sands
Unlike cohesive soils, installation disturbance in loose to medium-dense granular sands alters the localized void ratio and lateral stress conditions. The displacement action of the helix generally densifies loose sands, which can increase effective stress and shaft friction. However, if the rate of advance is incorrect—specifically, if the anchor rotates without adequate downward penetration—it effectively acts as an auger. This churning destroys the granular soil arching mechanism and necessitates a significant downward adjustment in short-term capacity estimates.
Evaluating Time-Dependent Set-Up Effects on Anchor Performance
Following installation, disturbed soils undergo a pore pressure equalization phase, leading to time-dependent capacity gains known as set-up or freeze. In saturated cohesive soils, this set-up factor can substantially increase ultimate holding capacity over a period of 7 to 30 days as the remolded clay regains its thixotropic strength. Specifying an immediate proof load test without accounting for this curing phase often results in false failures and the unnecessary scrapping of compliant hardware.
Correlating Installation Torque Spikes with Soil Density Changes
Continuous monitoring of installation torque serves as a real-time proxy for in-situ soil density changes. A gradual, steady increase in torque typically indicates uniform soil densification or a transition into a stiffer stratum. Conversely, sudden, erratic torque spikes often signify obstructions, cobble layers, or localized densification. These torque responses must be correlated with the site’s stratigraphic profile to validate that the helical plates are anchored in the intended load-bearing horizon.
Conclusion
Field failures cost more than reorders. When torque readings don’t match static load test results, engineers find out too late that published K-values for a 1-1/4″ square shaft in clay don’t hold in loose sand. You eat the replacement cost mid-project. Even anchors passing torque checks fail displacement thresholds during axial testing because soil remolding drops bearing capacity 15-20%. These spec-to-field gaps drive our in-house load testing per IEC 120 standards on every production batch.
Twenty-one years of export work taught us that field failures trace to manufacturing inconsistency more often than bad geotechnical data. Our 10-person QC team runs a double-review process — 100% of products get inspected twice before packaging. That’s how we catch defects before they surface in your customer’s load test. Contact our engineering team for custom anchor specs or physical samples matched to your soil profile.
Frequently Asked Questions
What are helical anchor specification types?
Helical anchor specifications generally fall into three categories: performance, prescriptive, and open specifications. Performance specs focus on required load capacities and soil conditions rather than exact dimensions. Prescriptive specs dictate precise material grades, shaft dimensions, and helix geometries.
Which specification type requires load testing?
Performance specifications explicitly require load testing to verify that the installed foundations meet project design criteria. Rather than relying solely on manufacturing tolerances, this spec mandates field validation of torque-to-capacity ratios. This ensures the anchor performs safely under actual site conditions.
What is torque-to-capacity ratio in helical anchors?
The torque-to-capacity ratio is an empirical relationship used to estimate the ultimate axial capacity of an installed helical anchor. As the helix advances into denser soil, the required installation torque increases, indicating higher bearing capacity. This ratio allows engineers to verify foundation stability in real-time during installation.
Are factory load tests necessary for helical anchors?
Factory load tests are essential to verify the mechanical strength of the anchor shaft, welds, and helix plates independent of soil mechanics. While field tests measure soil capacity, factory tests ensure the physical hardware will not yield under maximum torque or tensile stress. These production tests validate the material properties and overall manufacturing quality.
What defines a successful anchor load test?
A successful load test occurs when the helical anchor holds the required proof load for a specific duration without failure or excessive creep. The total deflection measured during the test must remain within acceptable engineering tolerances defined by the project specifications. This validation provides the engineer of record with quantifiable data to approve the foundation.